

NatiivNatiiv
NatiivNatiiv
HomeTechnologyHow we workCase studies
NatiivNatiiv

AI operations for commerce and distribution — built by operators.

Contact us →
Product
Company BrainInside the Company BrainFAQ
Home
OverviewTrack RecordThe LoopGovernance
Technology
OverviewInside the Company BrainAdd-onsConnected
How we work
OverviewThe methodExpertsTeam
Case Studies
All case studiesConsumer HealthGaming OperationsLogistics
Legal
Privacy PolicyTerms of UseCookies
SG · MY · ID · TH · VN · PH · US
LinkedIn
© 2026 NATIIV
← ALL CASE STUDIES
GAMING OPERATIONS · FINANCE REPORTING WITHOUT THE MANUAL WORK

Multi-Site Online Gaming Operator

Eleven sites, three platforms, one agentic reporting system — built in four weeks.

reporting / today
The reporting dashboard, today's report, on desktop
The AI data analyst answering a question on a phone
01
$0KSaved per year in finance and operations reporting
02
0 → 0Sites across three platforms, feeding one agentic dashboard
03
0+Data points processed into reports every day
04
Ask & answerAn AI data analyst the finance team questions in plain language
BEFORE · BY HAND, EVERY DAY11 LOGINS
PLATFORM A
01
02
03
04
PLATFORM B
05
06
07
08
PLATFORM C
09
10
11
ST
Staff log in, copy, paste× 11 SITES · × 3 BACK OFFICES
SPREADSHEETS · REBUILT DAILY
FINANCE SIGN-OFF? NUMBERS NOT TRUSTED
THE CHALLENGE

An operator doing $20M USD a month in revenue was running its finance and operations reporting by hand. Every day, staff logged into eleven separate sites across three different back-office platforms, pulled the figures, and rebuilt the same reports in spreadsheets. It was slow, it tied up experienced people, and it went wrong often enough that finance couldn’t fully trust the numbers it was signing off.

WHAT WE DID

Natiiv built the replacement in four weeks. Agents now log into every site, capture the figures, reconcile them across platforms, and deliver the daily reports into a single dashboard — more than ten thousand data points a day, with no human collecting anything. On top of the dashboard sits an AI data analyst: the finance team asks it questions in plain language and gets an answer from the live data, instead of raising a request and waiting for someone to build a report. The manual reporting cycle is gone, along with roughly $120,000 a year of the labour that ran it.
AFTER · AGENT-RUN, EVERY DAYLIVE
01
02
03
04
05
06
07
08
09
10
11
CAPTURE→RECONCILE→DELIVER
ONE DASHBOARD · RECONCILED10,000+ PTS / DAY
✓ MATCHED ACROSS 3 PLATFORMS · 0 MANUAL STEPS
AI DATA ANALYST
Which site was down on turnover this week, and why?
Site 07 — turnover down week on week. Here are the figures behind it, from today’s live data.
HOW IT WORKS
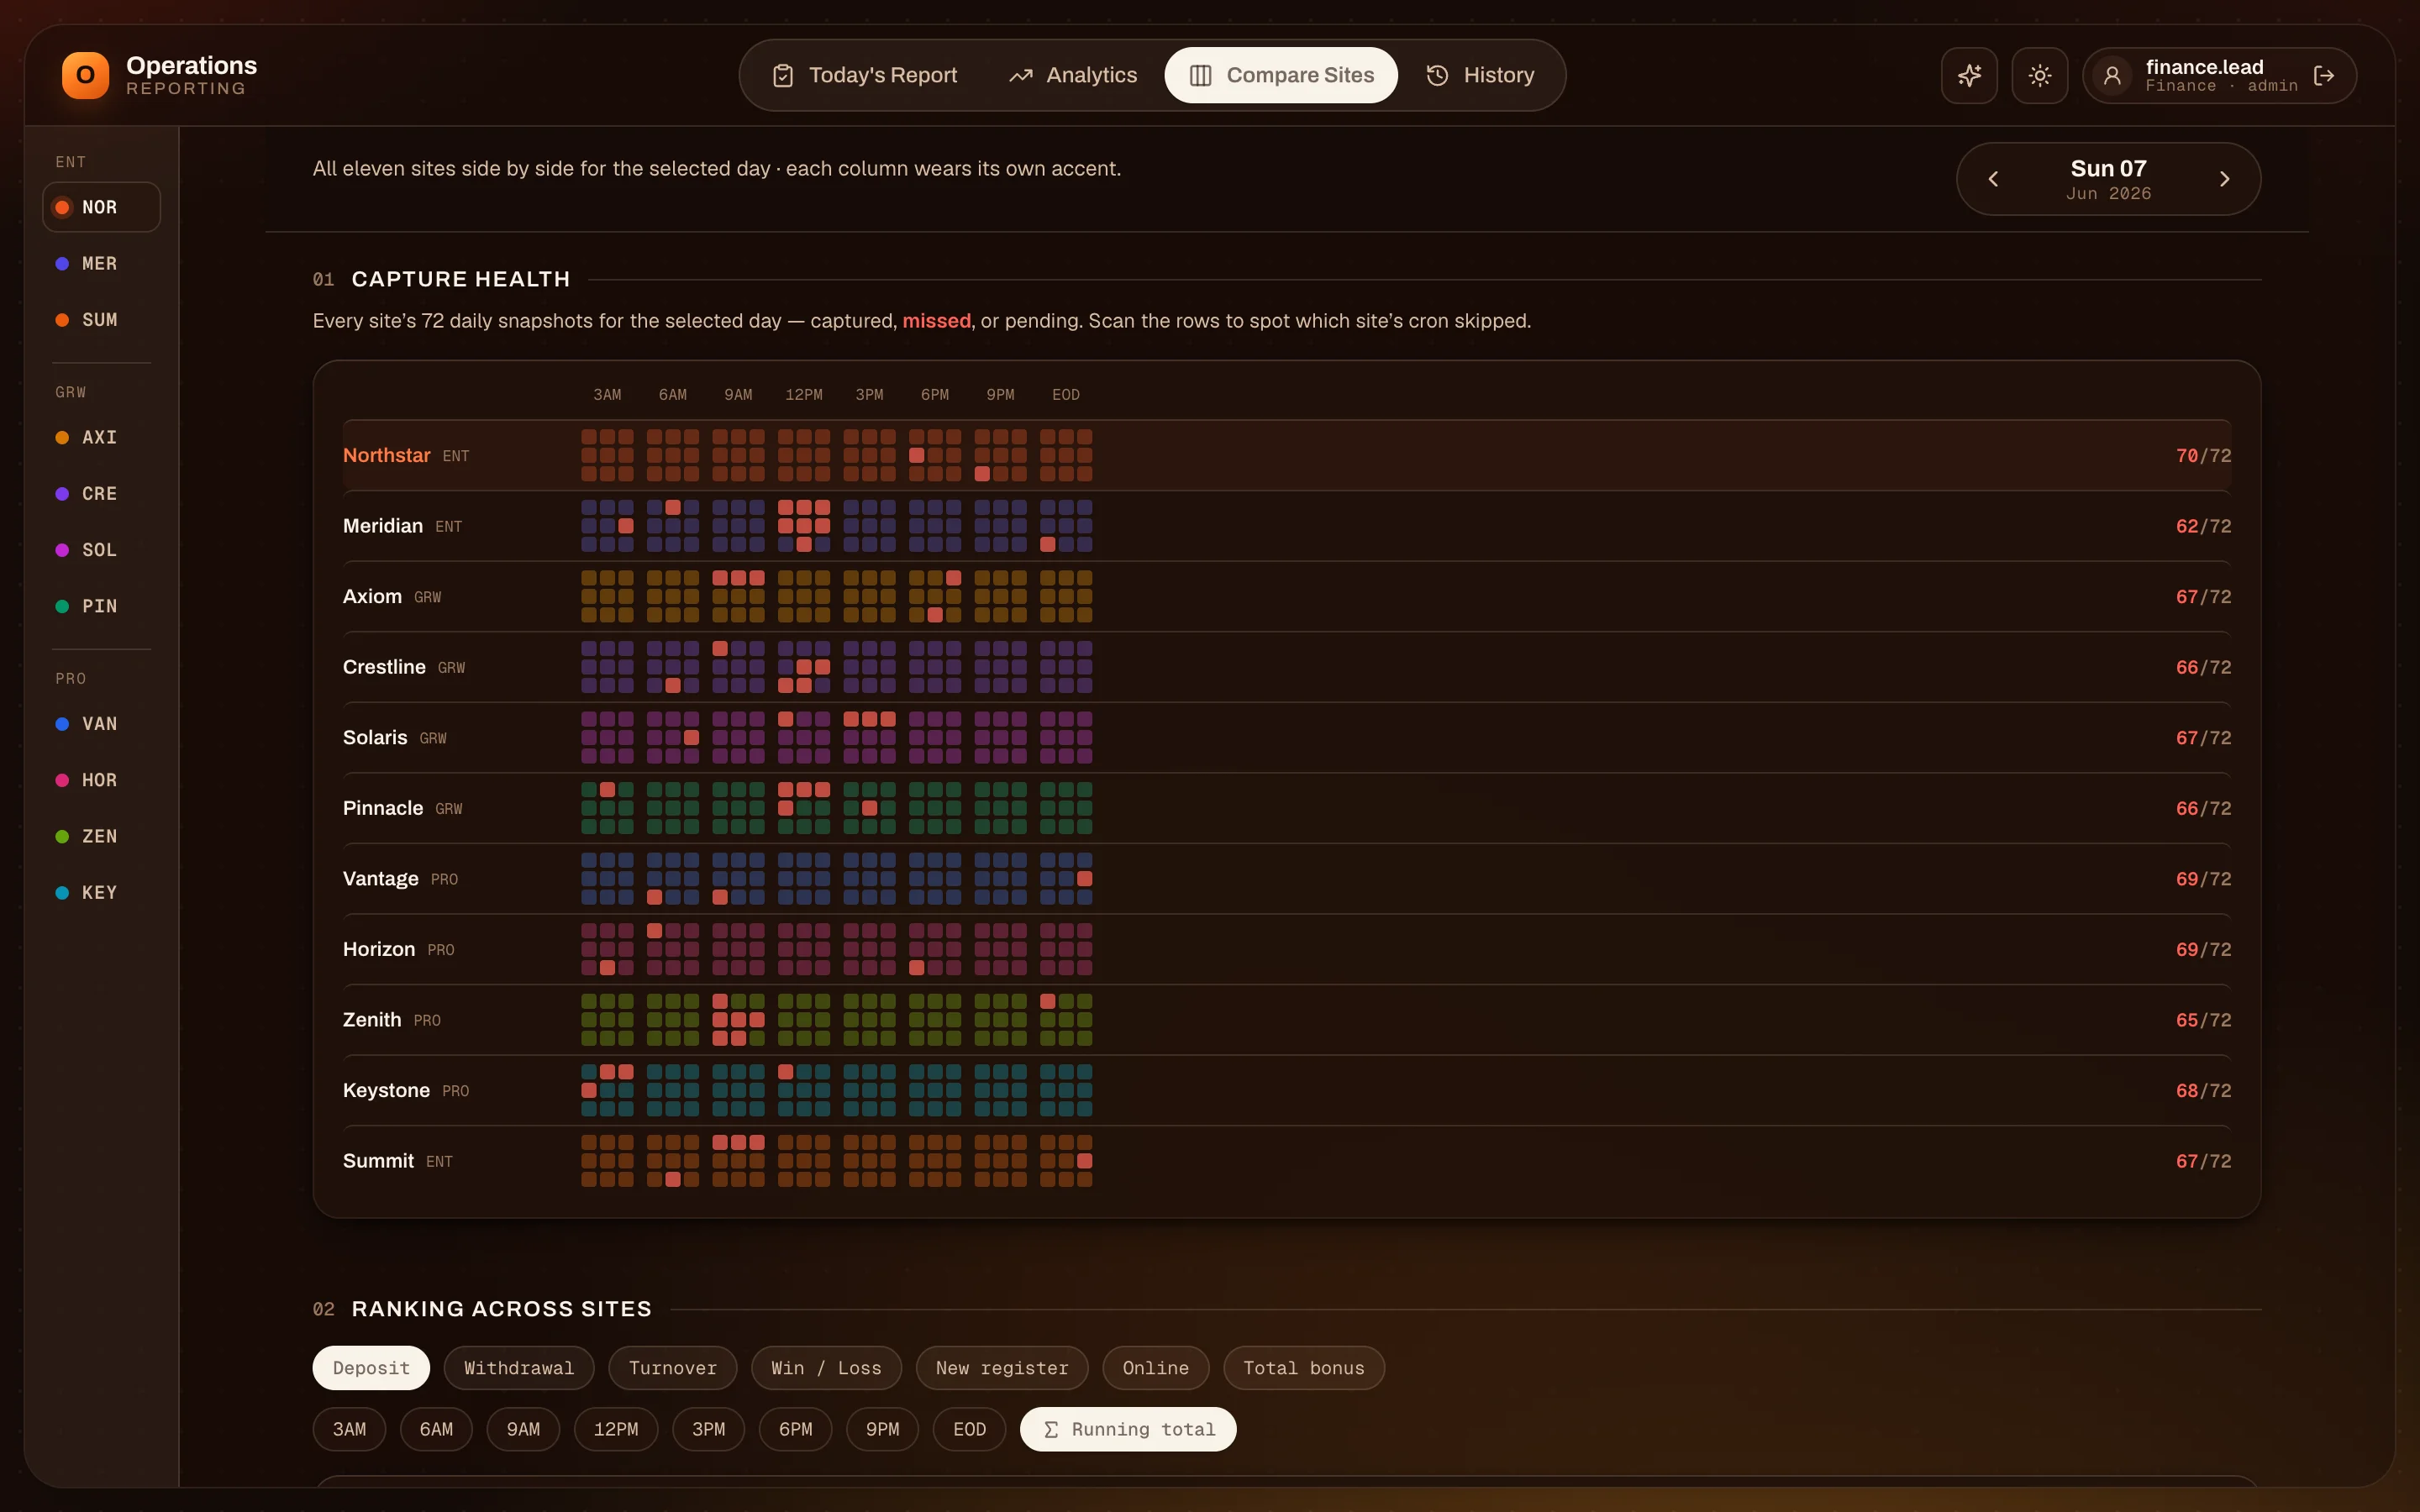
Capture health grid for all eleven sites
01

Agents do the collecting.

Every site and platform is captured automatically on a schedule, including the ones with no export and no API. When a site changes, the agent adapts; when something fails, it says so instead of reporting a quiet zero.
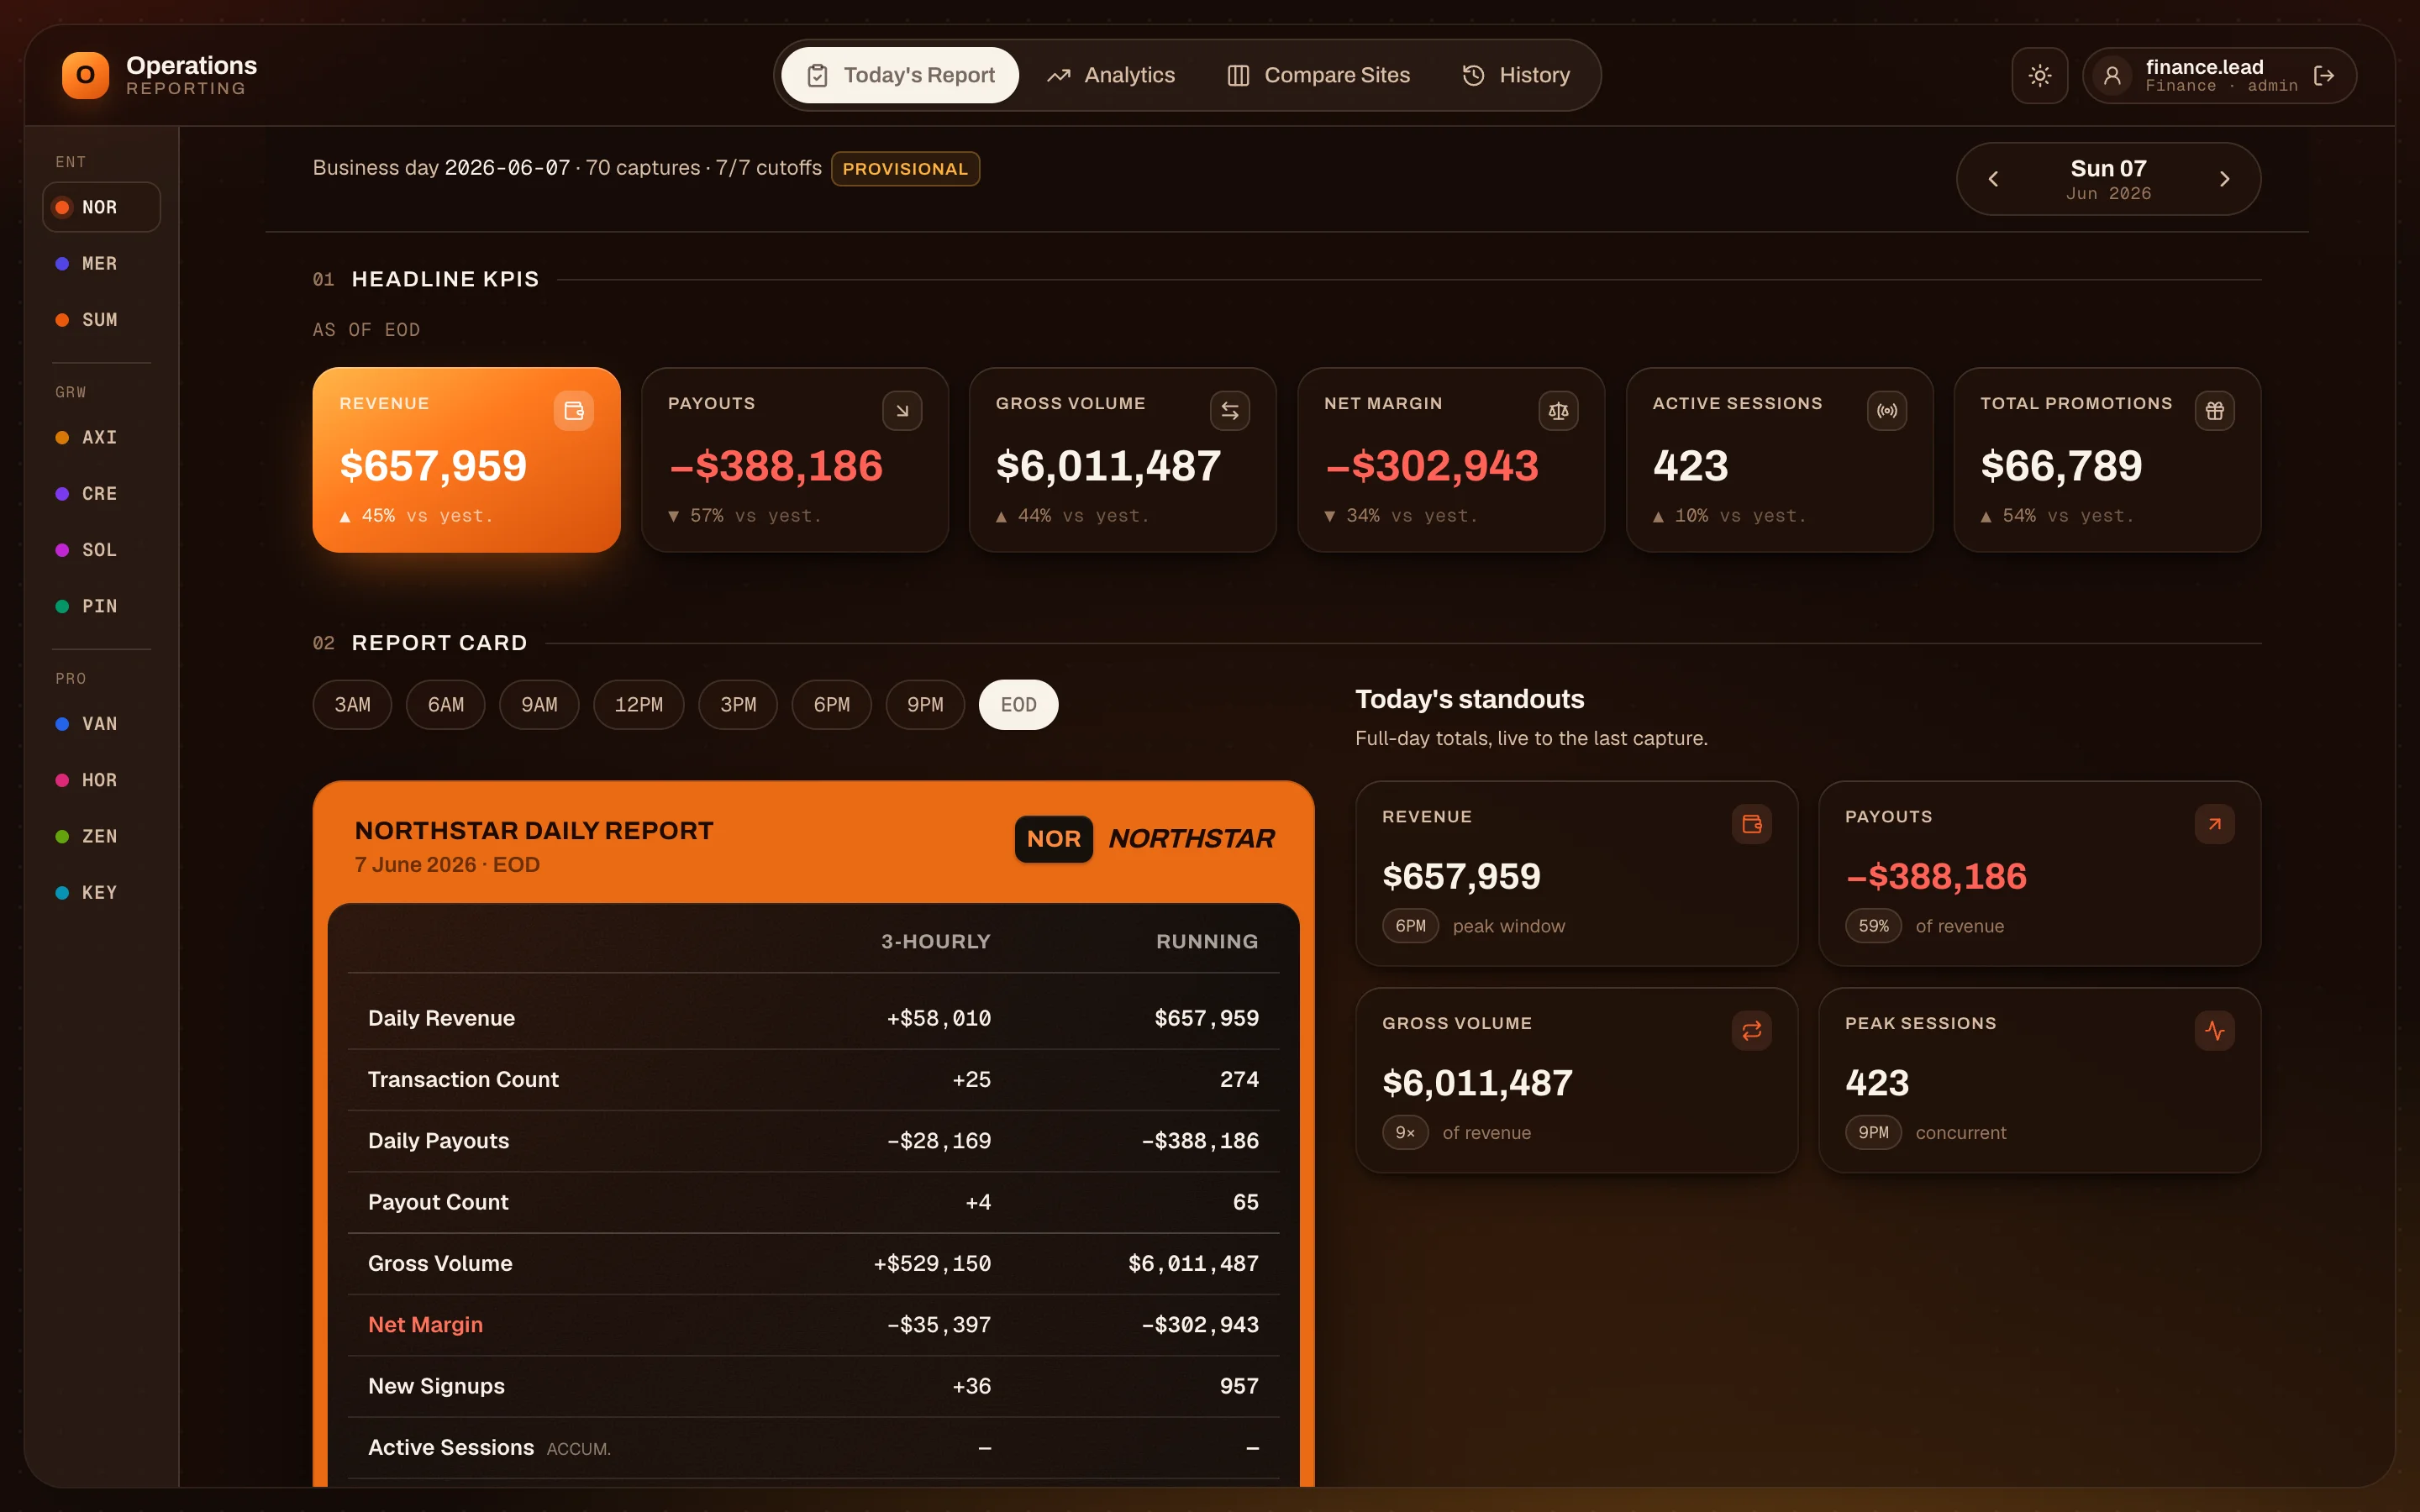
Reconciled daily report and headline figures in one dashboard
02

One dashboard, reconciled.

Figures from all eleven sites land in one place, matched against each other and against the operator’s own reporting rules, so finance sees one consistent picture rather than eleven partial ones.
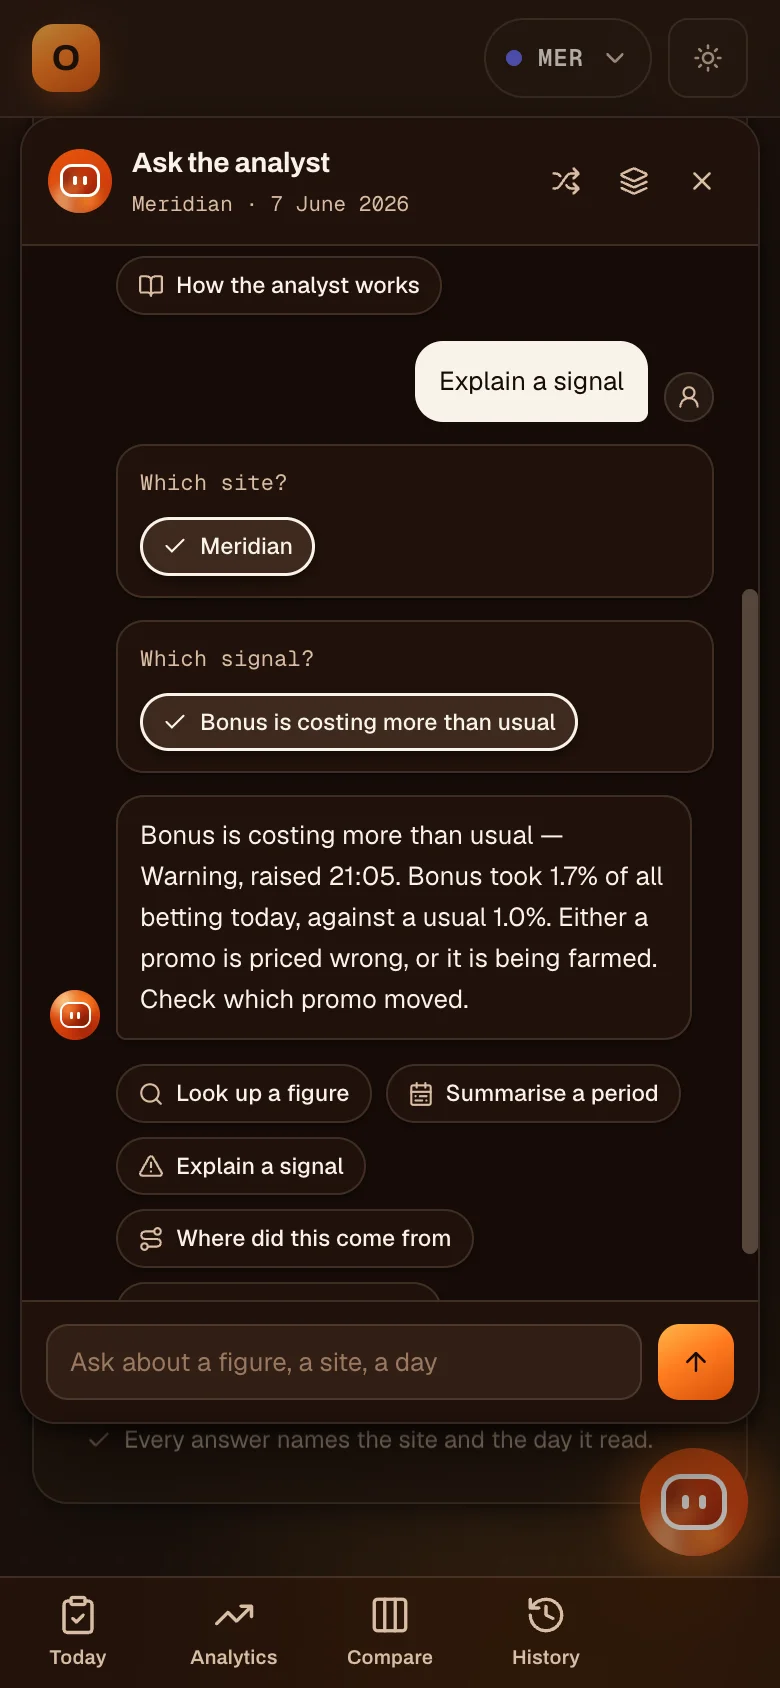
The AI data analyst answering a question on a phone
03

An analyst you can question.

The AI data analyst sits on the reconciled data. “Which site was down on turnover this week and why?” gets an answer in seconds, with the numbers behind it — no ticket, no queue.

MORE CASE STUDIES
CONSUMER HEALTHMulti-Brand Consumer Health Group, Japan
→
LOGISTICSSEA Cross-Border Logistics Aggregator
→

Operated, not advised.

Bring us your operation. We’ll run it with you.

Book a working session →